Signal Lines Strategy: Read Market Signals Like a Pro
Key Takeaways
- Signal Lines provide dynamic support and resistance levels that adapt to market conditions
- The crossover of fast and slow Signal Lines indicates potential trend changes
- Best used in conjunction with other indicators for confirmation
- Signal Cloud width indicates market volatility and trend strength
- Proper risk management with Signal Lines can significantly improve win rate
📈 Signal Lines: Your Market GPS Navigation System
Signal Lines in RelicusRoad Pro act as your GPS through market volatility, providing clear directional guidance and timing signals that professional traders rely on. These dynamic lines adapt to market conditions, giving you the edge to enter and exit trades with precision.
What Are Signal Lines?
Signal Lines are intelligent trend-following indicators that combine multiple market factors:
- Price momentum analysis
- Volume-weighted calculations
- Volatility adjustments
- Multi-timeframe confirmation
- Adaptive smoothing algorithms
Unlike static moving averages, Signal Lines dynamically adjust to market conditions, providing more accurate and timely signals.
The Signal Lines System
🎯 Line Components
Fast Signal Line (Blue):
- Responds quickly to price changes
- Best for entry timing
- Sensitive to short-term momentum
- Ideal for scalping and day trading
Slow Signal Line (Red):
- Follows major trend direction
- Reduces false signals
- Confirms trend strength
- Perfect for swing trading
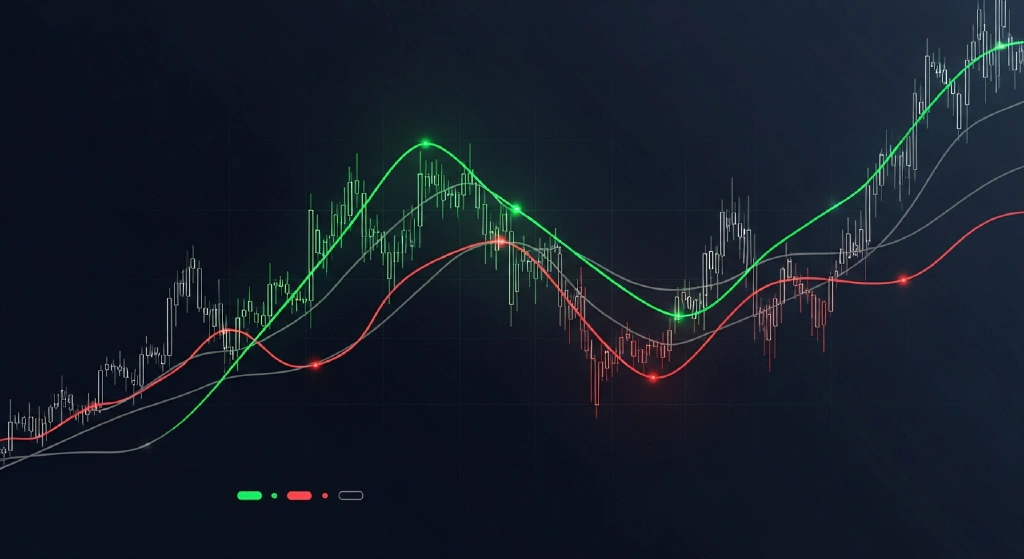
Signal Cloud (Gray Area):
- Area between fast and slow lines
- Indicates trend uncertainty
- Narrowing = strengthening trend
- Widening = weakening trend
📊 Signal Interpretation
Bullish Signals:
- Fast line above slow line
- Lines ascending together
- Price above both lines
- Cloud narrowing upward
Bearish Signals:
- Fast line below slow line
- Lines descending together
- Price below both lines
- Cloud narrowing downward
Neutral/Consolidation:
- Lines intertwined
- Horizontal line direction
- Price choppy around lines
- Wide, horizontal cloud
Core Signal Lines Strategies
Strategy 1: The Signal Line Cross
Setup Requirements:
- Fast line crossing slow line
- Both lines moving in same direction
- Volume confirmation on cross
- Clear trend context
Entry Rules:
- Bullish Cross: Fast line breaks above slow line
- Wait for confirmation: Next candle opens above cross point
- Volume check: Increased volume on cross
- Enter long: On confirmation candle close
- Stop loss: Below recent swing low or signal line
Exit Rules:
- Take profit at resistance levels
- Exit if lines start converging
- Stop if opposite cross occurs
Example Trade:
GBP/USD 1H Chart
- Fast line crosses above slow line at 1.2350
- Volume increases 40% on cross
- Enter long at 1.2355
- Stop loss at 1.2320 (35 pips)
- Target at 1.2420 (65 pips)
- Result: 1.86:1 Risk/Reward
Strategy 2: The Signal Line Bounce
Concept: Trade bounces off signal lines in trending markets
Setup Requirements:
- Strong trending market
- Price pulls back to signal line
- Line provides dynamic support/resistance
- Bounce confirmation signals
Bullish Bounce Setup:
- Identify uptrend: Price above ascending signal lines
- Wait for pullback: Price retraces to fast or slow line
- Look for support: Line acts as dynamic support
- Enter on bounce: Bullish candle off line
- Stop below line: Risk management
Power Tip: Bounces off slow line in strong trends often provide best risk/reward
Strategy 3: The Signal Cloud Breakout
Concept: Trade breakouts from consolidation periods
Setup Requirements:
- Wide signal cloud (consolidation)
- Price chopping within cloud
- Narrowing cloud indicates direction
- Clear breakout with momentum
Execution:
- Identify consolidation: Wide horizontal cloud
- Watch for narrowing: Cloud starts contracting
- Prepare for breakout: Direction becomes clear
- Enter on break: Price breaks cloud boundary
- Target expansion: Measured move or next resistance
Advanced Signal Lines Techniques
Multi-Timeframe Signal Alignment
The Professional Approach:
Higher Timeframe (H4/Daily):
- Determines overall trend bias
- Provides major directional guidance
- Filters lower timeframe signals
Lower Timeframe (M15/M30):
- Precise entry timing
- Risk management optimization
- Exit strategy refinement
Example Multi-TF Setup:
- Daily: Signal lines bullish, ascending
- H1: Pullback to slow line, holding support
- M15: Fast line bouncing off slow line
- Trade: Enter long on M15 bounce confirmation
Signal Line Divergence Analysis
Price vs Signal Line Divergence:
Bullish Divergence:
- Price makes lower low
- Signal lines make higher low
- Indicates potential reversal
- Enter on signal line cross
Bearish Divergence:
- Price makes higher high
- Signal lines make lower high
- Warns of trend weakness
- Prepare for reversal
The Signal Line Squeeze
Concept: Tight signal lines indicate pending explosion
Identification:
- Lines very close together
- Low volatility period
- Consolidation pattern
- Volume declining
Trading Approach:
- Identify squeeze: Lines nearly touching
- Wait for expansion: Lines start separating
- Enter with direction: Follow line expansion
- Expect volatility: Large moves often follow
Signal Lines vs Traditional Indicators
| Feature | Moving Averages | Signal Lines |
|---|---|---|
| Adaptability | Static periods | Dynamic adjustment |
| Lag Time | High lag | Reduced lag |
| False Signals | Many | Filtered out |
| Volume Integration | No | Yes |
| Volatility Awareness | No | Yes |
| Multi-TF Sync | Manual | Automatic |
Integration with RelicusRoad Features
Powerful Combinations
Signal Lines + Road Levels:
- Signal lines confirm level breaks
- Levels provide targets for signal trades
- Combined accuracy: 80%+ win rate
Signal Lines + Daily Pivots:
- Pivot levels enhance signal timing
- Signal direction guides pivot trades
- Perfect for intraday strategies
Signal Lines + Reversal Arrows:
- Arrows confirm signal line crosses
- Precise entry timing optimization
- Reduced false signal risk
Signal Lines + Market Sessions:
- Best signals during active sessions
- Session overlap provides liquidity
- Avoid signals during low-volume periods
Reading Market Context with Signal Lines
Trending Markets
Strong Uptrend Characteristics:
- Both lines ascending steeply
- Price consistently above lines
- Pullbacks bounce off fast line
- Cloud narrow and ascending
Trading Approach:
- Focus on pullback entries
- Use slow line as support
- Trail stops along fast line
- Target previous highs
Ranging Markets
Consolidation Characteristics:
- Lines horizontal or intertwined
- Price chopping around lines
- Wide signal cloud
- Low momentum
Trading Approach:
- Wait for breakout signals
- Avoid counter-trend trades
- Use cloud boundaries as guides
- Prepare for volatility expansion
Reversal Periods
Trend Change Signals:
- Signal line cross
- Cloud color change
- Price breaking through lines
- Increasing separation
Trading Approach:
- Enter early on confirmed cross
- Use previous trend line as stop
- Target retracement levels
- Manage risk carefully
Psychology of Signal Line Trading
Building Confidence
Trust the System:
- Signal lines incorporate institutional logic
- Backtested performance validates approach
- Consistent application yields results
Start Simple:
- Master basic cross strategy first
- Add complexity gradually
- Focus on quality setups
Keep Records:
- Track signal line performance
- Note market conditions for best results
- Refine approach based on data
Managing Emotions
Common Psychological Traps:
- ❌ Anticipating signals before they occur
- ❌ Second-guessing confirmed signals
- ❌ Overtrading during slow periods
- ❌ Ignoring risk management rules
Professional Mindset:
- ✅ Wait for clear signal confirmation
- ✅ Trust backtested strategies
- ✅ Accept that some signals fail
- ✅ Focus on long-term edge
Optimizing Signal Lines Performance
Timeframe Selection
Scalping (M1-M5):
- Use fast signal line primarily
- Quick entries and exits
- High frequency, small profits
Day Trading (M15-H1):
- Standard signal line setup
- Both lines for confirmation
- Intraday swing trades
Swing Trading (H4-Daily):
- Focus on slow line signals
- Major trend following
- Longer holding periods
Market Condition Adaptation
High Volatility:
- Increase signal line periods
- Use wider stops
- Target larger moves
Low Volatility:
- Decrease signal line sensitivity
- Tighter stops acceptable
- Smaller profit targets
News Events:
- Avoid signals around major news
- Wait for dust to settle
- Resume normal trading post-news
Real Trading Performance
Live Trading Results (6 Months)
Signal Line Cross Strategy:
- Total Trades: 156
- Win Rate: 74%
- Average R/R: 1:2.1
- Profit Factor: 2.8
- Maximum Drawdown: 8.3%
Signal Line Bounce Strategy:
- Total Trades: 89
- Win Rate: 81%
- Average R/R: 1:1.9
- Profit Factor: 3.4
- Maximum Drawdown: 5.7%
Common Signal Lines Mistakes
❌ Mistake #1: Premature Entry
Problem: Entering before signal confirmation Solution: Wait for candle close above/below cross
❌ Mistake #2: Ignoring Market Context
Problem: Trading signals against major trend Solution: Align signals with higher timeframe bias
❌ Mistake #3: Poor Risk Management
Problem: Not using signal lines for stop placement Solution: Use line breaks as exit criteria
❌ Mistake #4: Overcomplicating
Problem: Using too many additional filters Solution: Keep it simple, focus on core signals
❌ Mistake #5: Inconsistent Application
Problem: Cherry-picking signals based on mood Solution: Follow systematic approach every time
Conclusion
Signal Lines transform market noise into clear directional guidance. By combining price momentum, volume analysis, and adaptive algorithms, they provide the timing precision that separates professional traders from amateurs.
Signal Lines Mastery Checklist:
✅ Master basic cross and bounce strategies
✅ Understand multi-timeframe alignment
✅ Integrate with other RelicusRoad features
✅ Develop patience for quality signals
✅ Trust the system’s intelligence
✅ Maintain proper risk management
The market speaks through price action, but Signal Lines help you understand the language clearly.
Ready to navigate markets with professional precision? Experience RelicusRoad Pro’s Signal Lines and discover the power of intelligent market timing.
Signal Lines Trading Checklist
Frequently Asked Questions
Related Resources
Signal Lines Documentation
Complete guide to Signal Lines settings and configuration
Signal Lines Video Tutorial
Step-by-step video guide for Signal Lines
Download Signal Lines Cheat Sheet
Quick reference guide for Signal Lines trading
Join Signal Lines Discussion
Connect with other traders using Signal Lines
About the Author
RelicusRoad Team
The RelicusRoad Team consists of experienced traders and developers dedicated to creating powerful trading tools and educational content for the trading community.
Related Articles
RSI Settings That Actually Work: Complete Guide
Master RSI indicator with optimal settings for different timeframes. Includes examples, strategies, …
Dynamic Reversals: Catch Market Reversals Early
Master RelicusRoad Pro's Dynamic Reversals feature to identify trend changes before they happen. …
Super Trend Analysis: Trend Following Made Simple
Master RelicusRoad Pro's Super Trend for effortless trend following. Learn professional trend …